Carbon emission
The cement manufacturing industry
accounts for 7-8% of world’s
greenhouse gas emissions (CO2),
which contribute significantly to global
warming. With a focus on achieving
carbon neutrality and contributing
to the fight against climate change,
cement manufacturers are undertaking
focused initiatives – from improving
energy and process efficiency
to using lower-carbon fuels, and
reducing clinker-to-cement ratio to
deploying innovative technology for
resource optimisation.
At Ambuja Cement, we have
undertaken four key initiatives to
reduce our carbon emissions:
- Reduce clinker factor through
incremental use of alternative
materials like fly ash, slag, and
waste gypsum
- Improve energy efficiency
(thermal and electrical) and
process technology
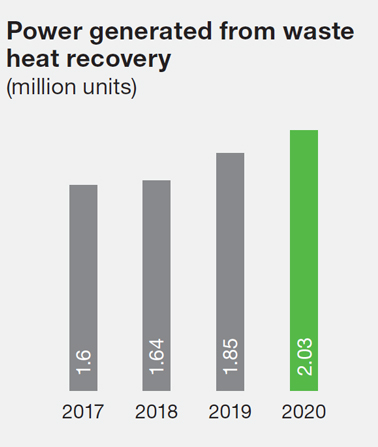
- Waste heat recovery and use of
Renewable Energy (RE)
- Optimise fuel composition, along
with the use of waste as
alternative fuel
These initiatives helped our operations
avoid release of ~6.5 million tonnes of
CO2 into the environment during 2020.
By 2020, the estimated financial
implications of the climate change
related risks before taking action are
projected to be ~`3,128 million; and the
cost of mitigation action is projected at
~`10,380 million.
Of CO2 emissions avoided
in 2020
(million tonnes)
~6.5
Estimated financial implication of
climate change related risks
(`crores)
312.8
Estimated cost of mitigation of climate
change related risks
(`crores)
1,038
We monitor and report CO2 emissions
from all manufacturing locations,
including integrated cement plants,
mines, grinding units, and bulk cement
terminals, aligned with the WBCSD
CSI Cement CO2 and Energy Protocol.
At Ambuja Cement, we estimate
and disclose our environmental
performance as per CSI and GRI
guidelines and annually in the Carbon
Disclosure Project (CDP) and Dow
Jones Sustainability Index (DJSI).
The GHG inventory includes:
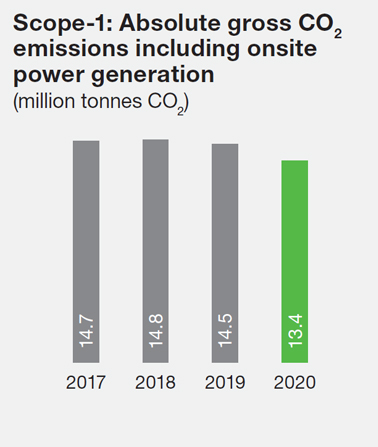
Scope-1: It covers direct emissions
from owned or controlled sources
including emissions due to fuel
combustion in kilns, fuel combustion
other than in kilns like onsite energy
generation and during clinker
production (calcination of raw
materials, bypass dust and cement kiln
dust, among others).
Scope-2: It covers emissions
associated with purchased electricity
from grid.
Scope-3: It includes other indirect
GHG emissions including emissions
from purchased products and services
(category-1); fuel and energy-related
activities (category-3); upstream
and downstream transportation and
distribution (category-4 & 9); waste
generated in operations (category-5);
business travel (category-6); and
employee commuting (category-7).
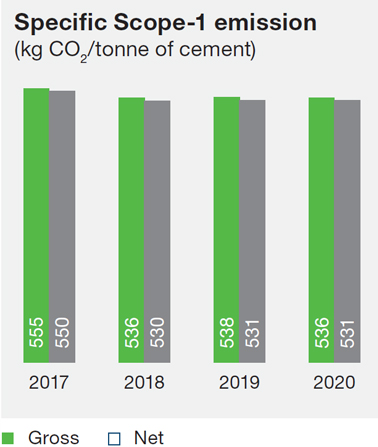
Performance in 2020
- Specific net CO2 per tonne of
cementitious product was 531 kg,
down 31% (taking 1990 levels
as the baseline) and 94% of our
2020 targets
- Total Scope-1 emission decreased
from 14.52 million tonnes in 2019 to
13.41 million tonnes in 2020
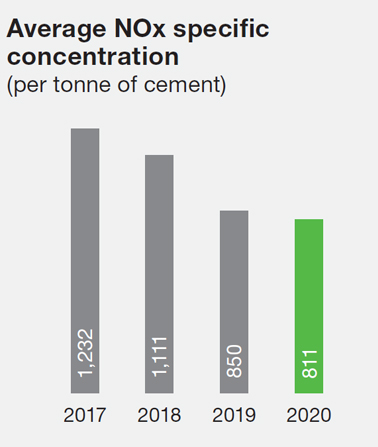
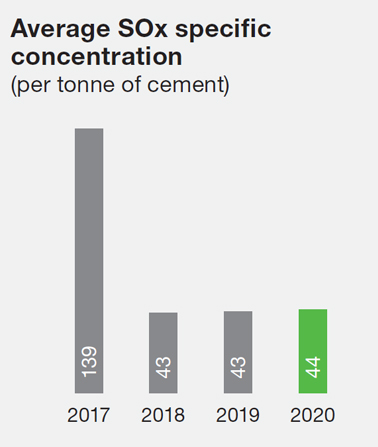
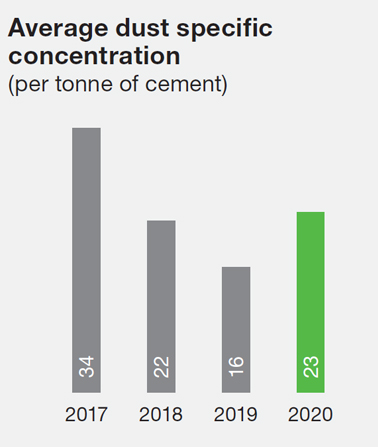
Other emissions
Our manufacturing process does not
emit any Ozone-Depleting Substances
(ODS). The ODS data covers the
core processes only and not the
administrative facilities (office buildings,
staff quarters among others) at the
plants and offices. We have installed
Continuous Emission Monitoring
Systems (CEMS) to continuously
monitor SO2, NOx, dust/particulate
matters and any other significant
emissions from all our nine kilns/
raw mill stacks. The data is displayed
in real-time on the website of the
regulatory agencies. The emissions
are load calculated and reported. It
excludes captive power plants and
other stacks. Our commitment to
emission minimisation is reflected in
our investments in Selective
Non-Catalytic Reduction (SNCR)
systems, new Electro-Static
Precipitators (ESPs) and bag house
modifications, among others.
Energy management
We have undertaken various strategic
initiatives to reduce our energy intensity
across the cement value chain.
The implementation of ISO 50001:2011
standards speaks volumes about our
sustained efforts towards augmenting
our energy management system.
We focus on increasing the share of
renewables such as solar, biomass,
and wind. We are using AFR and waste
heat recovery. In the process, we have been constantly setting industry
benchmarks in energy efficiency.
Performance in 2020
- Energy accounted for 24% of total
operating costs vis-à-vis 25%
in 2019
- Captive sources accounted for 66%
of power requirements vis-à-vis
68% during 2019
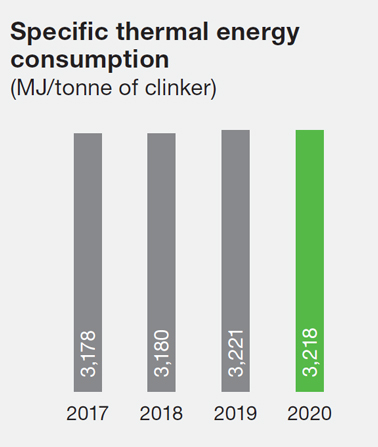
- Thermal energy efficiency stood at
3,218 MJ/tonne clinker as against
3,221 MJ/tonne clinker
- Electrical energy consumption
stood at 77.05 kWh/tonne of cement
versus 77.27 kWh/tonne
- Alternative Fuel (AF) in the kilns
achieved a Thermal Substitution
Rate (TSR) of 4.2% of the total
thermal energy vis-à-vis 5.4%
A detailed list of various energy
efficiency measures taken are enlisted
in the Annexure – VI (Page 142),
available on the link: ambujacement.
com/investors/annual-reports.
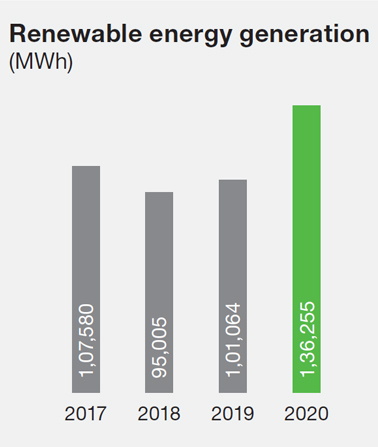
Renewable Energy (RE)
RE remains one of the key focus areas
for us to minimise carbon footprint.
Performance in 2020
- Renewable sources contributed
12% to total power generation
against 7.9% in 2019
- Reduced ~92,659 tonnes and
32,695 tonnes of CO2 through use
of RE and WHRS, respectively,
vis-à-vis 60,757 tonnes and 32,222
tonnes in 2019
- 5.14 MW solar-based station
at Rabriyawas, Rajasthan
(commenced in 2020)
- Dadri, Uttar Pradesh started
sourcing solar-based power through
Power Purchase Agreement (PPA)
from November 2020 (project
capacity of ~14 MW)
Our other renewable energy portfolio in
operation are:
- 30 MW coal and biomass-based
power plant at Ropar, Punjab
- 7.5 MW wind power station in
Kutch, Gujarat
- 330 KV solar power station at
Bhatapara, Chhattisgarh
- 55.14 kWp rooftop solar PV project
at the Gurgaon office, NCR
- 6.5 MW waste heat recoverybased
power generation system at
Rabriyawas plant, Rajasthan
Our captive power plants also use
biomass. Along with the earned
renewable energy certificates, the
power cost optimisation strategy helps
us in adding value to power sourcing
and be compliant in renewable
purchase obligations.