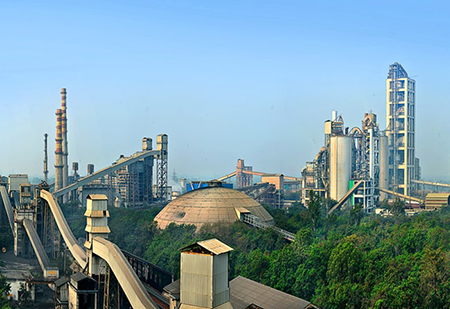
The team decided that it was time to refocus their energies and accelerate its digitalisation efforts. By now, the Transport Analytics Centre (TAC)—launched a couple of years ago—had evolved and moved to the next level, addressing the twin needs of trucker safety and real-time route optimisation. TAC had now become the single source of truth for the entire supply chain.
Soon, TAC fine-tuned its features to optimise production and despatch schedules, rationalise routes, help build a more robust order allocation programme, thus enhancing management of the e-platform driven freight procurement.
As a result, our trucker partners’ minimised time spent on roads, optimised pick-up and delivery, ensuring all essential documentation was easily available on their devices for swifter transit. For Ambuja, it provided a single-window view for the efficient management of costs, time, driver well-being and customer satisfaction.
Besides, this marked a significant milestone in Ambuja’s journey towards automation of our processes and controls.
 spirit that every challenge is an opportunity to do better, THE TEAM went the last mile to ensure digitisation would come to the rescue of serving our customers better.
Shareholders and investors

Employees

Dealers

Suppliers

Community

Developments and key initiatives |

KPIs |
|
GROWTH |
Achieved a historic high revenue |
23%growth in revenues In CY2021 |
MARGIN MANAGEMENT AND
|
|
21%growth in EBITDA 40 bpsdecline in EBITDA margin 90 bpsdecline in net profit margin In CY2021 |
FINANCIAL STABILITY |
|
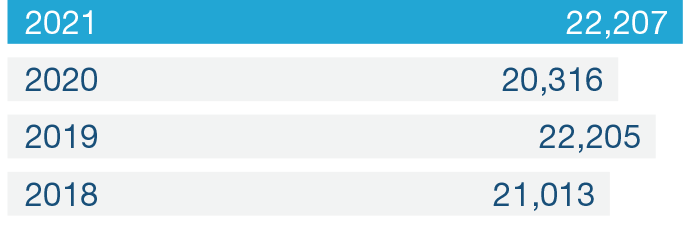
` 21,810 crOther equity ` 22,207 crNet worth As on December 31, 2021 |
SHAREHOLDER RETURNS |
|
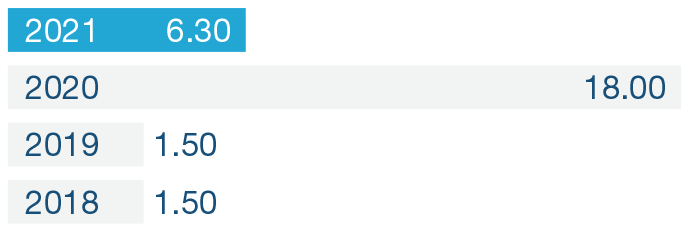
` 1,251 crProposed payout for the year 2021 |
We ensure regular operations are at an optimum level. Our operational KPIs are compared with internal and external benchmarks to achieve higher productivity and yields. Our innovative marketing initiatives and various ongoing digital programmes provide better customer connect and reach, and higher realisations. This operational efficiency enables us to generate positive cash flows from operations. We have a robust financial planning process that assesses the requirement of funds for sustainable business operations as well as for investments towards present and future business sustainability and growth opportunities.
Driven by strong volume growth and realisations, we reported one of the best performances ever in the history of Ambuja Cement.
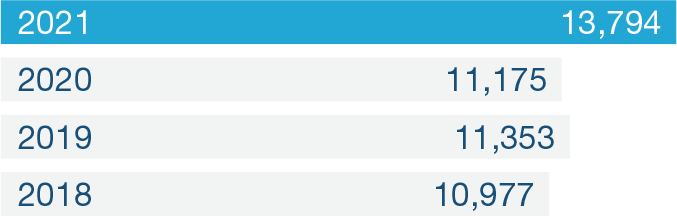
During the year, we reported a revenue of `13,965 crore, a 23% growth over the 2020 revenue of `11,372 crore. Performance was driven by a strong demand, which led to 1,100 bps growth in capacity utilisation as well as continued focus on the premium category, resulting in 4% growth in average realisations over that in 2020.
Strong growth in volumes along with better realisation led to a 21% growth in EBITDA from `2,647 crore in 2020 to `3,207 crore in 2021. EBITDA margin for the year reported a 40 bps marginal decline from 23.7% in 2020 to 23.3% in 2021.
In the face of an inflationary environment, cost optimisation initiatives were undertaken in operations and logistics through our ‘Plants of Tomorrow’ and other programmes. Total cost per tonne reported 3% increase during the year.
Other expenses per tonne increased by 4% in 2021 over 2020.
Robust improvement in core business performance and low interest outgo resulted in strong profit growth. EBIT during the year reported a growth of 25%, from `2,125 crore in 2020 to `2,656 crore in 2021. Pre-tax profit registered a growth of 15% from `2,414 crore in 2020 to `2,785 crore in 2021. Pre-tax profit margin decline 140 bps from 21.6% in 2020 to 20.2% in 2021.
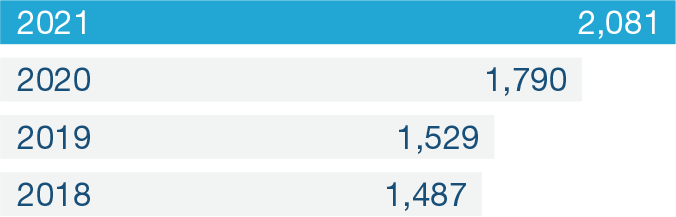
Our net profit for the year registered a 16% increase from `1,790 crore in 2020 to `2,081 crore in 2021. Net profit margin for the year showed a decline by 90 bps from 16% in 2020 to 15.1% in 2021.
Earnings per share in 2021 witnessed a 16% growth from `9.02 in 2020 to `10.48 in 2021.
Our total assets reported a growth of 11% from `25,481 crore in 2020 to `28,173 crore in 2021. Current assets accounted for 24.0% of the total assets during the year under review against 17.4% in 2020.
Our funding profile strengthened further during the year on the basis of a strong profit generation that boosted the Company’s equity base.
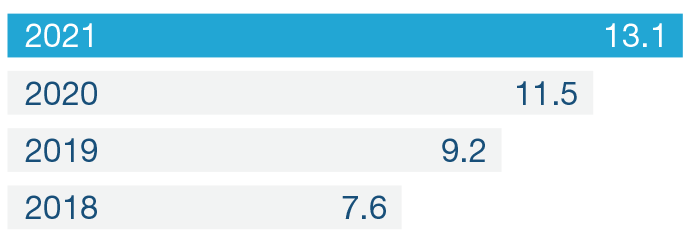
Our effective utilisation of capital and strong EBITDA helped us post 160 bps increase in return on capital employed over 2020.
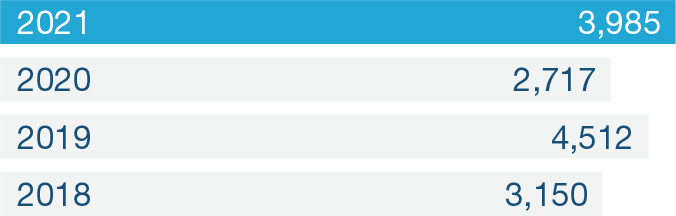
Our cash position strengthened during the year, reflecting the broadbased improvement in operational performance. Cash used in investing activities increased by 37% from `641 crore in 2020 to `882 crore in 2021. Net cash balance stood at `3,985 crore at the end of 2021 against `2,717 crore at the end of 2020.