
Sensing the urgency to combat climate change, we have developed 2030 carbon emission reduction targets, validated by the Science Based Targets initiative (SBTi). We have also partnered with Carbon Disclosure Project (CDP) India’s SBTi Incubator Program to put in place a decarbonisation roadmap.
We are also enriching the low-carbon building materials value chain with innovative green solutions, such as Ambuja Kawach that has 30% lower carbon footprint as compared to OPC products and Ambuja Buildcem that uses fly ash to produce high strength Portland Pozzolana Cement (PPC) while conserving natural resources. Ambuja Cool Walls replaces clay brick walls with pre-cast concrete inbuilt with a special heat barrier technology that keeps houses 5oC cooler during summers and warmer in winters.
 ethos that will ensure growth and sustainability go handin-hand for a shared future.
Dealer

Employees

Government and regulatory authorities

Suppliers

Community


Developments and key initiatives |

KPIs |
|
CLIMATE AND ENERGY |
|
2 . 2 kgreduction in CO2 emission per tonne of cement 3 %reduction in Specific Thermal Energy Consumption |
WATER AND NATURE |
|
8xwater positive 63%clinker factor |
CIRCULAR ECONOMY |
|
8 . 6 mtof waste co-processed 3 . 5 xplastic negative |
We associate with various regional and global bodies to implement our sustainability objectives, particularly those related to the environment. In 2020-2021, we participated in a pilot project on Natural Capital Accounting and Valuation of Ecosystem ServicesBusiness Accounting Pilot Case (NCAVES) with UN Statistics Division (UNSD) based on which a case study has been published by the UN (https://seea.un.org/content/business-andnatural-capital-accounting-case-studyambuja-cement-india). The project was supported by the European Union.
We continue to invest in improving our environmental performance, which results in significant cost savings. During 2021, we spent ~ `31 crore towards climate change resilience, including environmental protection, energy efficiency, compliance management, etc., which led to savings of `5 crore.
At the end of 2021, three cases involving environment-related issues were pending in different courts. No significant fines or penalties (>$10,000) were incurred in 2021. No formal grievance about environmental impact had been filed through the various grievance mechanisms during the reporting period. Through our advocacy and action, we intend to ensure that climate change measures are integrated into national policies, strategies, and planning.
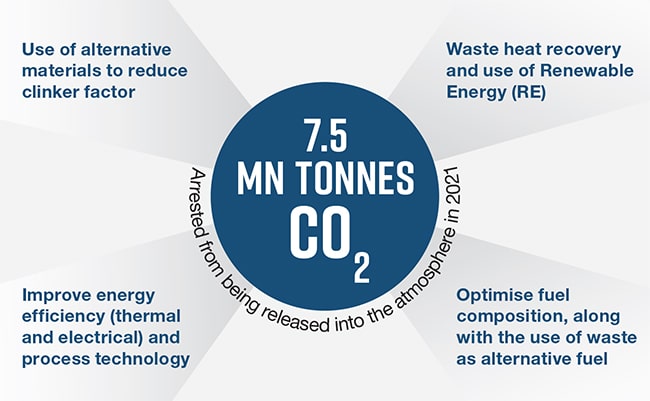
Aware of the cement industry’s contribution in GHG emissions globally, we have undertaken a four-pronged strategy to reduce our carbon emission.
In alignment with World Business Council for Sustainable Development (WBCSD) Cement Sustainability Initiative (CSI) CO2 protocol, we monitor and report our emissions from all manufacturing locations. We disclose our environmental performance as per CSI and GRI guidelines and annually in the Carbon Disclosure Project (CDP) and Dow Jones Sustainability Index (DJSI).
Our Scope 1 emissions include direct emissions from owned or controlled sources, including emissions due to fuel combustion in kilns or from onsite energy generation and clinker production. Scope 2 emissions are associated with purchased electricity from grid. Scope 3 emissions include other indirect GHG emissions, including emissions from purchased products and services, fuel and energy-related activities, upstream and downstream transportation and distribution, waste generated in operations, business travel and employee commuting among others.
Performance in 2021
Our manufacturing process does not emit any ozone depleting substance (ODS). The ODS data covers only core processes and not the administrative facilities, which include office buildings, staff quarters among others at plants and offices. The installed continuous monitoring systems across our plants help us monitor NOx, dust/particulate matter and any other significant emissions from our ten kilns or raw mill stacks. Real-time display of this data, except for data on captive power plants and other stacks, is made available on the website of the regulatory agencies. Further, we have invested in Selective Non-Catalytic Reduction (SNCR) systems, new Electro-Static Precipitators (ESPs) and baghouse modifications, reinforcing our commitment towards emission minimisation.
We are undertaking measures to reduce our energy intensity across the cement value chain and have implemented ISO 50001:2011 standards to augment our energy management system. We are working relentlessly to increase the share of renewables such as solar, biomass, and wind in the energy mix. We are using alternative fuel and raw material (AFR) and waste heat recovery to increase our energy efficiency. We use waste derived raw materials like fly ash, slag, and waste gypsum etc. in our manufacturing process, which has resulted in lower clinker factor. We have also optimised our processes for use of low-grade limestone and waste derived alternative fuels. We are proud to have set new benchmarks in the industry in energy use.
Performance in 2021
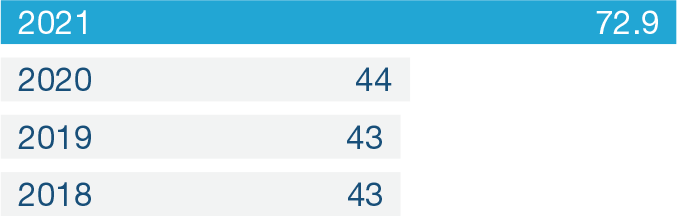
As a percentage of total operating cost, energy cost stood at 30% against 24% in 2020. About 63% of our power requirements are met through captive energy sources.

A detailed list of various energy efficiency measures taken are listed in the Annexure – VI, and also available on ambujacement.com/investors/annual-reports
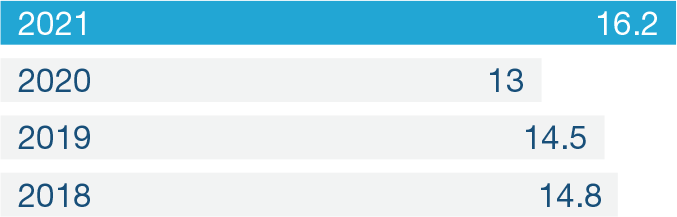
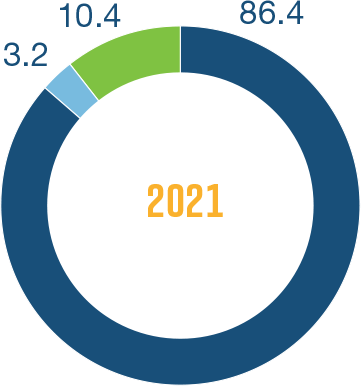
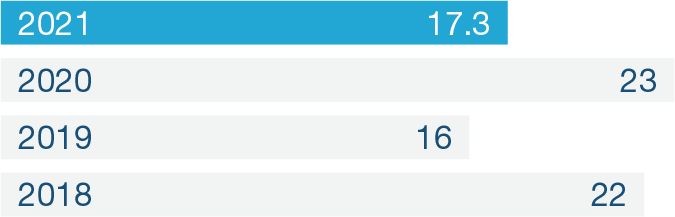
Renewable energy remains a key factor for reducing our carbon footprint.
Share of renewables in total power generation in 2021 (1.4% in 2020)
Performance in 2021
Coal and biomass-based power plant at Ropar, Punjab
Wind power station at Kutch, Gujarat
Solar power station at Bhatapara, Chhattisgarh
Rooftop solar PV project at Gurgaon office
WHR based power generation system at Rabriyawas, Rajasthan
We use biomass at the captive power plants as well. Along with renewable energy certificates, the power cost optimisation strategy also helps us add value to power sourcing and be compliant in renewable purchase obligations.
Water is among the key pillars of our Sustainable Development Plan 2030. Our dry process of cement production requires significantly less water than other processes. And now, our products are helping minimise the use of water in construction. Our steadfast efforts in ensuring water efficiency enabled us to turn 8x water positive in 2021.
Five of our plants are located in water scarce regions and we comply with all water related regulatory requirements. At our plants, we are maximising the use of recycled water that has been treated at our effluent treatment plants as well as reverse osmosis plants. Recycled water is also used for dust suppression and gardening, along with other purposes.
At the community level, we have undertaken water conservation and rainwater harvesting projects under the aegis of the Ambuja Cement Foundation (ACF), our CSR arm (Details can be found on page 80 & 81 of this report).
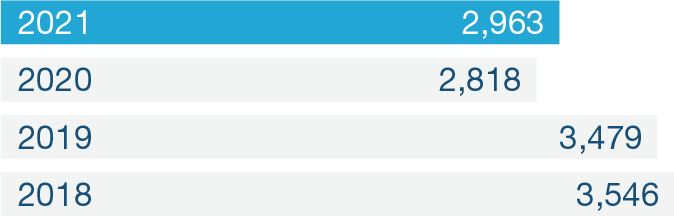
Performance in 2021
Of total water withdrawn was recycled in 2021 (15% in 2020)
Our water sustainability risk assessment framework has been developed in association with the International Union for Conservation of Nature (IUCN). It considers business/ company risks as well as the basin risk, covering various risk aspects and identifying units with water stress.
This assessment also uses the World Business Council for Sustainable Development (WBCSD) Global Water Tool. Scenario analysis to identify the potential impact on operations has also been conducted using country Specific India Water Tool. True Value assessment for water interventions in 2021 indicated a contribution of `1,544 crore.

UNMATCHED FEAT
1st ever by any cement company in the World, Ambuja Cement has been recognised for its leadership in Water Security 2021 by CDP, the global environmental non-profit, and secured a place on its prestigious ‘A List’ for tackling water sustainability. This achievement reaffirms our will to remain committed to addressing water scarcity in the future and contributing to the establishment of a sustainable tomorrow. The three initiatives – concrete mix proportions, modular curing, and rainwater harvesting – helped us save ~70 million litres of water, and promote sustainable construction initiative. We will continue to advocate for environmentallyfriendly solutions by actively taking part in such initiatives.
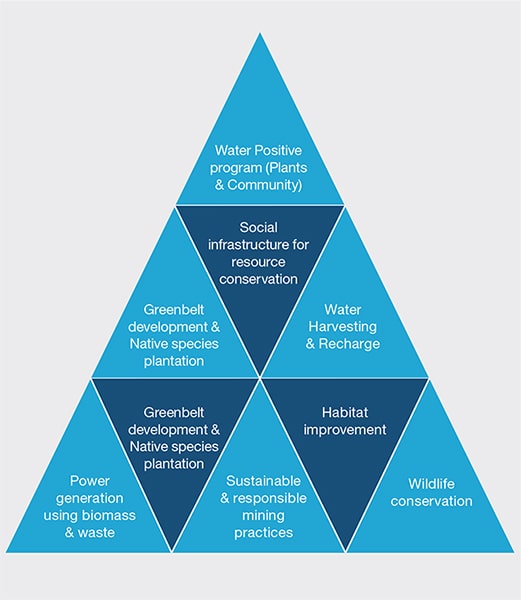
Our biodiversity policy is part of the Group’s Quarry Rehabilitation and Biodiversity Directive. We adhere to Indian national regulations and are a signatory to the India Business and Biodiversity Initiative (IBBI) of the Confederation of Indian Industry (CII), and Deutsche Gesellschaft für Internationale Zusammenarbeit (GIZ). We also partner with organisations/ industry associations like Global Climate Change Alliance (GCCA) for biodiversity-related policy management, assessment and reporting guidelines.
As part of our Sustainable Development Plan 2030, we are committed to achieving ‘Positive Change in Biodiversity’ (net positive impact) by 2030. For all our sites, we carefully classify our ecological assets and maintain a biodiversity inventory. We also assess the net positive impact through set KPIs every three years. For measuring this, we have implemented a new baseline biodiversity assessment at our sites through a Biodiversity Indicator and Reporting System (BIRS) developed by experts from the International Union for Conservation of Nature (IUCN). BIRS assessments were conducted in 2017, 2019 and 2020.
We are in the process of implementing mitigation hierarchy for our biodiversity management and conservation efforts which includes three key elements: avoid, minimise and restore. We avoid undertaking operations near any of the World Heritage Sites and IUCN Category I-IV protected areas. Our operating sites are not located adjacent to indigenous peoples’ territories.
We plant trees on the overburden and area around the mines and on the mine lease boundaries, which helps reduce dust pollution and promotes the absorption of carbon emissions and preservation of regional biodiversity. We regularly train our team members working closely with communities to ensure minimal impact on the biodiversity. Our overburden/interburden or waste material is disposed of separately in non-mineralised zones through an excavator-dumper-dozer combination as per the approved mine plan. Progressive mine closure plans are available as per statute for all locations.
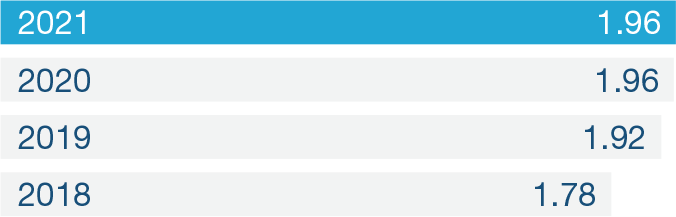
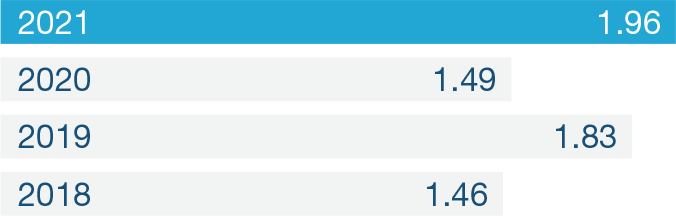
| Units | 2019-20 | 2016-17 |
|---|---|---|
| Ambujanagar, Gujarat | 1.9 | 1.7 |
| Darlaghat, Himachal Pradesh | 2.1 | 2.1 |
| Rabriyawas, Rajasthan | 2.3 | 2.1 |
| Maratha Cement Works, Maharashtra | 2.1 | 2.0 |
| Bhatapara, Chhattisgarh | 1.9 | 1.7 |
Protected areas like the Majathal Sanctuary and Darlaghat Conservation Reserve (both in Himachal Pradesh) are situated within 10 km of our mining/ plant operations at Darlaghat. The Gir sanctuary lies within 10 km of a mining site at Ambujanagar, Gujarat. We have prepared a wildlife conservation plan for key species, approved by the state government, for Darlaghat. Biodiversity Action Plan (BAP) for all our five plants with mining sites is being implemented.
We continuously monitor biodiversity and set protection and action priorities for species like IUCN red data list and regional threatened species list. We conduct periodic ecological study on species and habitats through our local partners such as the Gujarat Institute of Desert Ecology (GUIDE), university experts and research institutions to identify the causes of decline in species and take corrective measures.
Partnering with local experts and forest department to develop comprehensive biodiversity action plans with regional measurable targets across sites, and act on the outcomes of our assessment
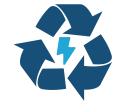
Through the Holcim brand, Geocycle, and the waste management arm of Ambuja Cement, we have emerged as a pioneer in the industry in effectively utilising waste in kiln co-processing.
Geocycle India is part of the global Geocycle network and has four dedicated pre-processing facilities with installations for blending liquids, shredding solids and sludge and homogenising waste before it is coprocessed sustainably at five locations. Through Geocycle, we co-process waste from other industries in our kilns as alternative fuel, thus promoting a circular economy and reducing the use of coal, which, in turn, results in natural resource conservation and GHG mitigation. Geocycle has already developed 14 co-processing facilities across India around AFR storage areas, feeding arrangement, and laboratories that support both ACC and Ambuja Cement. During the year under review, we co-processed ~3.7 million tonnes of alternative fuels, substituting 5.1% of total thermal energy.
Thermal substitution rate
(4.2% in 2020)
ACCELERATED APPROACH IN NEXT THREE YEARS TO TRIPLE TSR TO 15%, WITH KEY PLANTS ABOVE 20% TSR

Completely decomposes waste through high temperatures and long residence time

Leaves no residue

Reduces greenhouse gas emission

Saves public funds
Recovers energy and recycles mineral value of waste, if any

Leads to conservation of natural resources

Offers local waste management solution

Promotes a circular economy
Performance in 2021
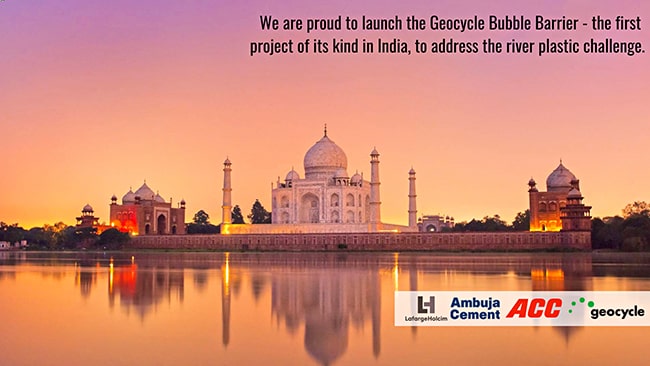
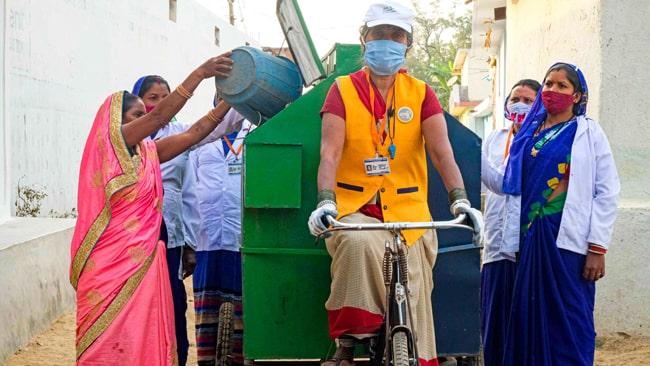
Further, with Geocycle, we are expanding our footprint across key markets for managing Refuse Derived Fuel (RDF) and EPR (Extended Producer Responsibility) plastics through the following ways:
Partnering for clean India


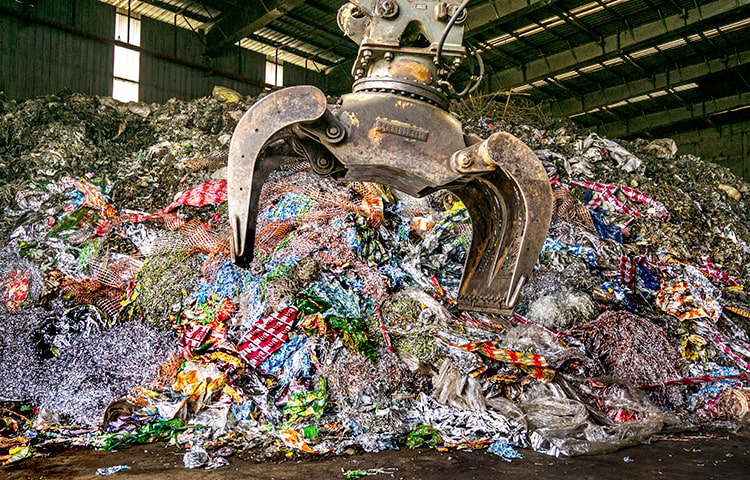
PUTTING A BARRIER
Plastics in our water bodies are causing irreversible damage to the environment and thus public health. That is why Holcim brought two cement giants of India to solve this problem. What emerged can be termed as the lightest approach from two corporate heavyweights: a bubble curtain. Through the bubble barrier technology, channelised bubbles push plastics to a collection point, after which they are ecologically co-processed in cement plants. This pilot project at the Mantola canal in Agra is expected to remove 2,400 tonnes of plastic, with more cities slated to receive their own bubble barrier. The initiative is in line with the government’s Swachh Bharat initiative, and a big step towards realising our vision of a better tomorrow.